Toggle navigation
Home
安装部署
Archives
Tags
kubernetes with stacked etcd 部署
2019-05-06 06:51:53
259
0
0
louyj
#Deployment ##precondition disable firewall systemctl stop firewalld systemctl disable firewalld disable swap swapoff -a config hostname ensure `local hostname` reachable vi /etc/hosts 139.162.127.39 node1 139.162.121.213 node2 139.162.97.24 node3 139.162.127.39 apiserver.example.com ##Install docker # Install Docker from CentOS/RHEL repository: yum install -y docker ---------------------------- # or install Docker CE 18.06 from Docker's CentOS repositories: ## Install prerequisites. yum install yum-utils device-mapper-persistent-data lvm2 ## Add docker repository. yum-config-manager \ --add-repo \ https://download.docker.com/linux/centos/docker-ce.repo ## Install docker. yum update && yum install docker-ce-18.06.1.ce ## Create /etc/docker directory. mkdir /etc/docker mkdir /docker # Setup daemon. cat > /etc/docker/daemon.json <<EOF { "log-driver": "json-file", "log-opts": { "max-size": "100m" }, "storage-opts": [ "overlay2.override_kernel_check=true" ], "bip": "172.17.0.1/24", "data-root": "/docker", "registry-mirrors": [ "https://1nj0zren.mirror.aliyuncs.com", "https://docker.mirrors.ustc.edu.cn", "http://f1361db2.m.daocloud.io", "https://registry.docker-cn.com" ] } EOF # "bip": "192.168.35.1/24" # ip link del docker0 mkdir -p /etc/systemd/system/docker.service.d # Restart docker. systemctl daemon-reload systemctl restart docker systemctl enable docker.service ##Install kubeadm, kubelet and kubectl Some users on RHEL/CentOS 7 have reported issues with traffic being routed incorrectly due to iptables being bypassed. You should ensure net.bridge.bridge-nf-call-iptables is set to 1 in your sysctl config, e.g. cat <<EOF > /etc/sysctl.d/k8s.conf net.bridge.bridge-nf-call-ip6tables = 1 net.bridge.bridge-nf-call-iptables = 1 EOF sysctl --system cat <<EOF > /etc/yum.repos.d/kubernetes.repo [kubernetes] name=Kubernetes baseurl=https://packages.cloud.google.com/yum/repos/kubernetes-el7-x86_64 enabled=1 gpgcheck=1 repo_gpgcheck=1 gpgkey=https://packages.cloud.google.com/yum/doc/yum-key.gpg https://packages.cloud.google.com/yum/doc/rpm-package-key.gpg exclude=kube* EOF #centos cat <<EOF > /etc/yum.repos.d/kubernetes.repo [kubernetes] name=Kubernetes baseurl=http://mirrors.aliyun.com/kubernetes/yum/repos/kubernetes-el7-x86_64 enabled=1 gpgcheck=0 repo_gpgcheck=0 gpgkey=http://mirrors.aliyun.com/kubernetes/yum/doc/yum-key.gpg http://mirrors.aliyun.com/kubernetes/yum/doc/rpm-package-key.gpg EOF #ubuntu apt-get update && apt-get install -y apt-transport-https curl https://mirrors.aliyun.com/kubernetes/apt/doc/apt-key.gpg | apt-key add - cat <<EOF >/etc/apt/sources.list.d/kubernetes.list deb https://mirrors.aliyun.com/kubernetes/apt/ kubernetes-xenial main EOF apt-get update apt-get install -y kubelet kubeadm kubectl # Set SELinux in permissive mode (effectively disabling it) setenforce 0 sed -i 's/^SELINUX=enforcing$/SELINUX=permissive/' /etc/selinux/config yum install -y kubelet kubeadm kubectl --disableexcludes=kubernetes ##config loadbalancer install and configure haproxy as loadbalancer yum install haproxy vi haproxy.cfg global log 127.0.0.1:514 local2 chroot /var/lib/haproxy pidfile /var/run/haproxy.pid maxconn 4000 user haproxy group haproxy daemon ulimit-n 51200 defaults log global mode tcp option dontlognull timeout connect 1000 timeout client 150000 timeout server 150000 frontend ss-in bind *:8888 default_backend ss-out backend ss-out server server1 139.162.127.39:6443 maxconn 20480 start haproxy haproxy -f haproxy.cfg add host entry in `/etc/hosts` file all nodes 172.105.195.168 apiserver.example.com ##Initializing your master ### Steps for the first control plane node On the first control plane node, create a configuration file called kubeadm-config.yaml vi kubeadm-config.yaml apiVersion: kubeadm.k8s.io/v1beta1 kind: ClusterConfiguration kubernetesVersion: v1.13.3 clusterName: 'TestKubeCluster' apiServer: certSANs: - apiserver.example.com controlPlaneEndpoint: "apiserver.example.com:8888" imageRepository: "k8s.gcr.io" networking: podSubnet: "10.244.0.0/16" serviceSubnet: "10.96.0.0/12" kubernetesVersion should be set to the Kubernetes version to use controlPlaneEndpoint should match the address or DNS and port of the load balancer It’s recommended that the versions of kubeadm, kubelet, kubectl and Kubernetes match. Some CNI network plugins like Calico require a CIDR such as 192.168.0.0/16 and some like Weave do not. See the CNI network documentation. To add a pod CIDR set the `podSubnet: 192.168.0.0/16` field under the `networking object of ClusterConfiguration`. see https://godoc.org/k8s.io/kubernetes/cmd/kubeadm/app/apis/kubeadm#Networking ImageRepository sets the container registry to pull images from. If empty, `k8s.gcr.io` will be used by default; in case of kubernetes version is a CI build (kubernetes version starts with `ci/` or `ci-cross/`) `gcr.io/kubernetes-ci-images` will be used as a default for control plane components and for kube-proxy, while `k8s.gcr.io` will be used for all the other images. use `"gcr.akscn.io/google_containers"` instead. Make sure that the node is in a clean state and then execute the following command to init master node kubeadm init --config=kubeadm-config.yaml --ignore-preflight-errors=NumCPU //--image-repository=gcr.azk8s.cn/google_containers ###configure kube environment To make kubectl work for your non-root user, run these commands, which are also part of the kubeadm init output USER=kube mkdir -p $USER/.kube sudo cp -i /etc/kubernetes/admin.conf $USER/.kube/config sudo chown $USER:$USER $USER/.kube/config Alternatively, if you are the root user, you can run: export KUBECONFIG=/etc/kubernetes/admin.conf systemctl enable kubelet && systemctl start kubelet ###Installing a pod network add-on Set /proc/sys/net/bridge/bridge-nf-call-iptables to 1 by running sysctl net.bridge.bridge-nf-call-iptables=1 to pass bridged IPv4 traffic to iptables’ chains. This is a requirement for some CNI plugins to work, for more information please see here. change `"Network": "10.244.0.0/16"` if needed. kubectl apply -f https://raw.githubusercontent.com/coreos/flannel/bc79dd1505b0c8681ece4de4c0d86c5cd2643275/Documentation/kube-flannel.yml Once a pod network has been installed, you can confirm that it is working by checking that the CoreDNS pod is Running in the output of kubectl get pods --all-namespaces ###check this master status Type the following and watch the pods of the components get started: kubectl get pod -n kube-system -o wide It’s recommended that you join new control plane nodes only after the first node has finished initializing ###init others master nodes Copy the certificate files from the first control plane node to the rest: In the following example, replace CONTROL_PLANE_IPS with the IP addresses of the other control plane nodes. USER=kube # customizable CONTROL_PLANE_IPS="139.162.121.213 139.162.97.24" for host in ${CONTROL_PLANE_IPS}; do scp /etc/kubernetes/pki/ca.crt "${USER}"@$host: scp /etc/kubernetes/pki/ca.key "${USER}"@$host: scp /etc/kubernetes/pki/sa.key "${USER}"@$host: scp /etc/kubernetes/pki/sa.pub "${USER}"@$host: scp /etc/kubernetes/pki/front-proxy-ca.crt "${USER}"@$host: scp /etc/kubernetes/pki/front-proxy-ca.key "${USER}"@$host: scp /etc/kubernetes/pki/etcd/ca.crt "${USER}"@$host:etcd-ca.crt scp /etc/kubernetes/pki/etcd/ca.key "${USER}"@$host:etcd-ca.key scp /etc/kubernetes/admin.conf "${USER}"@$host: done Steps for the rest of the control plane nodes ssh to others nodes then execute script, This script writes all the requested files in the /etc/kubernetes folder. USER=kube # customizable mkdir -p /etc/kubernetes/pki/etcd mv /home/${USER}/ca.crt /etc/kubernetes/pki/ mv /home/${USER}/ca.key /etc/kubernetes/pki/ mv /home/${USER}/sa.pub /etc/kubernetes/pki/ mv /home/${USER}/sa.key /etc/kubernetes/pki/ mv /home/${USER}/front-proxy-ca.crt /etc/kubernetes/pki/ mv /home/${USER}/front-proxy-ca.key /etc/kubernetes/pki/ mv /home/${USER}/etcd-ca.crt /etc/kubernetes/pki/etcd/ca.crt mv /home/${USER}/etcd-ca.key /etc/kubernetes/pki/etcd/ca.key mv /home/${USER}/admin.conf /etc/kubernetes/admin.conf Start `kubeadm join` on this node using the join command that was previously given to you by `kubeadm init` on the first node. It should look something like this kubeadm join apiserver.example.com:8888 --token 9hxm8t.vkcltner32vw5var --discovery-token-ca-cert-hash sha256:48f96cd652f6fe1e5107dacad80c3ac5fffa51180bf2df5904fee15eb4b475fc --experimental-control-plane Notice the addition of the --experimental-control-plane flag. This flag automates joining this control plane node to the cluster. ### check cluster status kubectl get nodes kubectl get pod -n kube-system ###Control plane node isolation (options) By default, your cluster will not schedule pods on the master for security reasons. If you want to be able to schedule pods on the master, e.g. for a single-machine Kubernetes cluster for development, run: kubectl taint nodes --all node-role.kubernetes.io/master- With output looking something like: node "test-01" untainted taint "node-role.kubernetes.io/master:" not found taint "node-role.kubernetes.io/master:" not found ##Joining your nodes The nodes are where your workloads (containers and pods, etc) run. To add new nodes to your cluster do the following for each machine: Run the command that was output by kubeadm init. For example: kubeadm join --token <token> <master-ip>:<master-port> --discovery-token-ca-cert-hash sha256:<hash> If you do not have the token, you can get it by running the following command on the master node: kubeadm token list By default, tokens expire after 24 hours. If you are joining a node to the cluster after the current token has expired, you can create a new token by running the following command on the master node: kubeadm token create kubeadm token create --print-join-command ##Controlling your cluster from machines other than the master(Optional) In order to get a kubectl on some other computer (e.g. laptop) to talk to your cluster, you need to copy the administrator kubeconfig file from your master to your workstation like this: scp root@<master ip>:/etc/kubernetes/admin.conf . kubectl --kubeconfig ./admin.conf get nodes ##Proxying API Server to localhost(Optional) If you want to connect to the API Server from outside the cluster you can use kubectl proxy scp root@<master ip>:/etc/kubernetes/admin.conf . kubectl --kubeconfig ./admin.conf proxy You can now access the API Server locally at http://localhost:8001/api/v1 ##Tear down(Optional) To undo what kubeadm did, you should first drain the node and make sure that the node is empty before shutting it down. Talking to the master with the appropriate credentials, run: kubectl drain <node name> --delete-local-data --force --ignore-daemonsets kubectl delete node <node name> Then, on the node being removed, reset all kubeadm installed state: kubeadm reset If you wish to start over simply run kubeadm init or kubeadm join with the appropriate arguments #Configuration ##Modify coredns ConfigMap kubectl get configmap coredns --namespace=kube-system -o yaml # modify upstream, proxy kubectl edit configmap coredns --namespace=kube-system -o yaml apiVersion: v1 data: Corefile: | .:53 { errors health kubernetes cluster.local in-addr.arpa ip6.arpa { pods insecure upstream 172.17.36.65 fallthrough in-addr.arpa ip6.arpa } prometheus :9153 proxy . 172.17.36.65 cache 30 loop reload loadbalance } kind: ConfigMap metadata: creationTimestamp: "2018-12-05T14:44:00Z" name: coredns namespace: kube-system resourceVersion: "125839" selfLink: /api/v1/namespaces/kube-system/configmaps/coredns uid: 33f0641a-f89c-11e8-b73e-005056b9b279 ##Configure kubelets using kubeadm The kubelet provides a versioned, structured API object that can configure most parameters in the kubelet and push out this configuration to each running kubelet in the cluster. This object is called the kubelet’s ComponentConfig The ComponentConfig allows the user to specify flags such as the cluster DNS IP addresses expressed as a list of values to a camelCased key, illustrated by the following example: apiVersion: kubelet.config.k8s.io/v1beta1 kind: KubeletConfiguration clusterDNS: - 10.96.0.10 By calling `kubeadm config print-default --api-objects KubeletConfiguration` you can see all the default values for this structure It is possible to configure the kubelet that kubeadm will start if a custom KubeletConfiguration API object is passed with a configuration file like so kubeadm ... --config some-config-file.yaml ###Workflow when using kubeadm init When you call kubeadm init, the kubelet configuration is marshalled to disk at `/var/lib/kubelet/config.yaml`, and also uploaded to a ConfigMap in the cluster. The ConfigMap is named `kubelet-config-1.X`, where `.X` is the `minor version` of the Kubernetes version you are initializing. A kubelet configuration file is also written to `/etc/kubernetes/kubelet.conf` with the baseline cluster-wide configuration for all kubelets in the cluster. This configuration file points to the client certificates that allow the kubelet to communicate with the API server. This addresses the need to propagate cluster-level configuration to each kubelet for instance-specific configuration, using environment file `/var/lib/kubelet/kubeadm-flags.env` After marshalling these two files to disk, kubeadm attempts to run the following two commands, if you are using systemd: systemctl daemon-reload && systemctl restart kubelet ###Workflow when using kubeadm join When you run `kubeadm join`, kubeadm uses the Bootstrap Token credential perform a TLS bootstrap, which fetches the credential needed to download the kubelet-config-1.X ConfigMap and writes it to `/var/lib/kubelet/config.yaml`. The dynamic environment file is generated in exactly the `same way as kubeadm init`. After the kubelet loads the new configuration, kubeadm writes the `/etc/kubernetes/bootstrap-kubelet.conf` KubeConfig file, which contains a CA certificate and Bootstrap Token. ###The kubelet drop-in file for systemd The configuration file installed by the kubeadm DEB or RPM package is written to `/etc/systemd/system/kubelet.service.d/10-kubeadm.conf` and is used by systemd see https://kubernetes.io/docs/setup/independent/kubelet-integration/ #Operation ##Deploying the Dashboard UI kubectl create -f https://raw.githubusercontent.com/kubernetes/dashboard/master/src/deploy/recommended/kubernetes-dashboard.yaml Accessing the Dashboard UI There are multiple ways you can access the Dashboard UI; either by using the kubectl command-line interface, or by accessing the Kubernetes master apiserver using your web browser ###Command line proxy You can access Dashboard using the kubectl command-line tool by running the following command: kubectl proxy Kubectl will handle authentication with apiserver and make Dashboard available at http://localhost:8001/api/v1/namespaces/kube-system/services/https:kubernetes-dashboard:/proxy/ ###Master server You may access the UI directly via the Kubernetes master apiserver. Open a browser and navigate to https://<master-ip>:<apiserver-port>/api/v1/namespaces/kube-system/services/https:kubernetes-dashboard:/proxy/, where <master-ip> is IP address or domain name of the Kubernetes master. Please note, this works only if the apiserver is set up to allow authentication with username and password. This is not currently the case with some setup tools (e.g., kubeadm). Refer to the authentication admin documentation for information on how to configure authentication manually. ###Admin privileges IMPORTANT: Make sure that you know what you are doing before proceeding. Granting admin privileges to Dashboard's Service Account might be a security risk. You can grant full admin privileges to Dashboard's Service Account by creating below ClusterRoleBinding. Copy the YAML file based on chosen installation method and save as, i.e. `dashboard-admin.yaml`. Use `kubectl create -f dashboard-admin.yaml` to deploy it. Afterwards you can use Skip option on login page to access Dashboard. Official release apiVersion: rbac.authorization.k8s.io/v1beta1 kind: ClusterRoleBinding metadata: name: kubernetes-dashboard labels: k8s-app: kubernetes-dashboard roleRef: apiGroup: rbac.authorization.k8s.io kind: ClusterRole name: cluster-admin subjects: - kind: ServiceAccount name: kubernetes-dashboard namespace: kube-system token kubectl -n kubernetes-dashboard describe secret $(kubectl -n kubernetes-dashboard get secret | grep cluster-admin | awk '{print $1}') ##Label nodes kubectl label nodes <node-name> <label-key>=<label-value> #delete label kubectl label nodes <node-name> <label-key>= https://kubernetes.io/docs/concepts/configuration/assign-pod-node/ ##Manually constructing apiserver proxy URLs As mentioned above, you use the kubectl cluster-info command to retrieve the service’s proxy URL. To create proxy URLs that include service endpoints, suffixes, and parameters, you simply append to the service’s proxy URL: `http://kubernetes_master_address/api/v1/namespaces/namespace_name/services/service_name[:port_name]/proxy` If you haven’t specified a name for your port, you don’t have to specify port_name in the URL. By default, the API server proxies to your service using http. To use https, prefix the service name with https:: `http://kubernetes_master_address/api/v1/namespaces/namespace_name/services/https:service_name:[port_name]/proxy` The supported formats for the name segment of the URL are: <service_name> - proxies to the default or unnamed port using http <service_name>:<port_name> - proxies to the specified port using http https:<service_name>: - proxies to the default or unnamed port using https (note the trailing colon) https:<service_name>:<port_name> - proxies to the specified port using https https://kubernetes.io/docs/tasks/access-application-cluster/access-cluster/ ##Kubectl Port Forwarding Forward a local port to a port on the pod `kubectl port-forward` allows using resource name, such as a pod name, to select a matching pod to port forward to since Kubernetes v1.10. kubectl port-forward redis-master-765d459796-258hz 7000:6379 which is the same as kubectl port-forward pods/redis-master-765d459796-258hz 7000:6379 or kubectl port-forward deployment/redis-master 7000:6379 or kubectl port-forward rs/redis-master 7000:6379 or kubectl port-forward svc/redis-master 7000:6379 Any of the above commands works. --streaming-connection-idle-timeout=0 ##Metrics Server esource Metrics API is an effort to provide a first-class Kubernetes API (stable, versioned, discoverable, available through apiserver and with client support) that serves resource usage metrics for pods and nodes. The use cases were discussed and the API was proposed a while ago in another proposal. This document describes the architecture and the design of the second part of this effort: making the mentioned API available in the same way as the other Kubernetes APIs. Clone source from github git clone https://github.com/kubernetes-incubator/metrics-server.git Modify configuration cd deploy/1.8+/ #change image xxxxxxx #edit metric-server deployment to add the flags # args: # - --kubelet-insecure-tls # - --kubelet-preferred-address-types=InternalIP,ExternalIP,Hostname 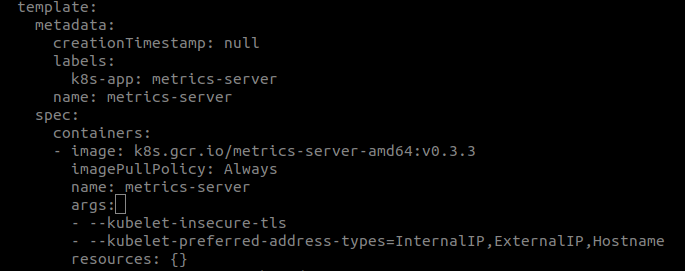 In order to deploy metrics-server in your cluster run the following command from the top-level directory of this repository: # Kubernetes 1.7 $ kubectl create -f deploy/1.7/ # Kubernetes > 1.8 $ kubectl create -f deploy/1.8+/ verify installation kubectl top node kubectl top pod -n dev ##Namespace with node selecter ``` apiVersion: v1 kind: Namespace metadata: name: test annotations: scheduler.alpha.kubernetes.io/node-selector: env=test ``` ##Kubernetes repo ``` cat <<EOF > /etc/yum.repos.d/kubernetes.repo [kubernetes] name=Kubernetes baseurl=http://mirrors.aliyun.com/kubernetes/yum/repos/kubernetes-el7-x86_64 enabled=1 gpgcheck=0 repo_gpgcheck=0 gpgkey=http://mirrors.aliyun.com/kubernetes/yum/doc/yum-key.gpg http://mirrors.aliyun.com/kubernetes/yum/doc/rpm-package-key.gpg EOF ``` ##Storage Class And Persistent Volumes ###Local storage Local volumes do not currently support dynamic provisioning, however a StorageClass should still be created to delay volume binding until pod scheduling. This is specified by the WaitForFirstConsumer volume binding mode. ####Local StorageClass ``` apiVersion: storage.k8s.io/v1 kind: StorageClass metadata: name: local-storage provisioner: kubernetes.io/no-provisioner volumeBindingMode: WaitForFirstConsumer ``` ####Local Persistent Volumes ``` apiVersion: v1 kind: PersistentVolume metadata: name: local-pv-master-01 spec: capacity: storage: 1Gi accessModes: - ReadWriteOnce persistentVolumeReclaimPolicy: Retain storageClassName: local local: path: /data2/master-01 nodeAffinity: required: nodeSelectorTerms: - matchExpressions: - key: kubernetes.io/hostname operator: In values: - app-uat-03.mjcndc01.com ``` ###Cephfs storage ####CephFS Volume Provisioner git clone https://github.com/kubernetes-incubator/external-storage.git Create a Ceph admin secret ``` ceph auth get-key client.admin > /tmp/secret kubectl create ns cephfs kubectl create secret generic ceph-secret-admin --from-file=/tmp/secret --namespace=cephfs ``` Start CephFS provisioner ``` cd external-storage-master/ceph/cephfs/deploy NAMESPACE=cephfs # change this if you want to deploy it in another namespace sed -r -i "s/namespace: [^ ]+/namespace: $NAMESPACE/g" ./rbac/*.yaml sed -r -i "N;s/(name: PROVISIONER_SECRET_NAMESPACE.*\n[[:space:]]*)value:.*/\1value: $NAMESPACE/" ./rbac/deployment.yaml kubectl -n $NAMESPACE apply -f ./rbac ``` ####Create a CephFS Storage Class Replace Ceph monitor's IP in example/class.yaml with your own and create storage class kubectl create -f example/class.yaml Create a claim kubectl create -f example/claim.yaml Create a Pod using the claim kubectl create -f example/test-pod.yaml ##CronJob //todo ##Rejoin node ``` kubeadm token create --print-join-command ``` ##Creating a kubeconfig file ###Fetch the name of the secrets used by the service account This can be found by running the following command: kubectl describe serviceAccounts -n serverless-backend serverless-backend-admin Note down the `Mountable secrets` information which has the name of the secret that holds the token ###Fetch the token from the secret Using the Mountable secrets value, you can get the token used by the service account. Run the following command to extract this information: kubectl describe secrets -n serverless-backend serverless-backend-admin-token-9hlww This will output the token information that looks something like above. Note down the `token` value ###Get the certificate info for the cluster Every cluster has a certificate that clients can use to encryt traffic. Fetch the certificate and write to a file by running this command. In this case, we are using a file name cluster-cert.txt ``` kubectl config view --flatten --minify > cluster-cert.txt cat cluster-cert.txt ``` Copy two pieces of information from here `certificate-authority-data` and `server` ###Create a kubeconfig file From the steps above, you should have the following pieces of information - token - certificate-authority-data - server Create a file called sa-config and paste this content on to it ``` apiVersion: v1 kind: Config users: - name: svcs-acct-dply user: token: <replace this with token info> clusters: - cluster: certificate-authority-data: <replace this with certificate-authority-data info> server: <replace this with server info> name: self-hosted-cluster contexts: - context: cluster: self-hosted-cluster user: svcs-acct-dply name: svcs-acct-context current-context: svcs-acct-context ``` Replace the placeholder above with the information gathered so far - replace the token - replace the certificate-authority-data - replace the server ###Copy the file to $HOME/.kube If you want your client to use this context, copy sa-config to $HOME/.kube and you can configure kubectl to use the context kubectl config --kubeconfig=$HOME/.kube/sa-config set-context svcs-acct-context ##Node Problem Detector node-problem-detector aims to make various node problems visible to the upstream layers in cluster management stack. It is a daemon which runs on each node, detects node problems and reports them to apiserver. node-problem-detector can either run as a DaemonSet or run standalone. There are tons of node problems that could possibly affect the pods running on the node, such as: - Infrastructure daemon issues: ntp service down; - Hardware issues: Bad cpu, memory or disk; - Kernel issues: Kernel deadlock, corrupted file system; - Container runtime issues: Unresponsive runtime daemon; Currently these problems are invisible to the upstream layers in cluster management stack, so Kubernetes will continue scheduling pods to the bad nodes. To solve this problem, we introduced this new daemon node-problem-detector to collect node problems from various daemons and make them visible to the upstream layers. Once upstream layers have the visibility to those problems, we can discuss the remedy system node-problem-detector uses Event and NodeCondition to report problems to apiserver. - NodeCondition: Permanent problem that makes the node unavailable for pods should be reported as NodeCondition. - Event: Temporary problem that has limited impact on pod but is informative should be reported as Event. ###Installation The easiest way to install node-problem-detector into your cluster is to use the Helm chart: helm install stable/node-problem-detector --name nosy-scorpion --namespace node-daemon To verify that the node-problem-detector pods have started, run: kubectl --namespace=node-daemon get pods -l "app.kubernetes.io/name=node-problem-detector,app.kubernetes.io/instance=nosy-scorpion" ##Prometheus Integration Install Prometheus operator in a different namespace. It is preferable to keep your monitoring containers in a separate namespace. helm install stable/prometheus-operator --name prometheus-operator --namespace monitor If everything got installed perfectly, you can see these pods available ``` $ kubectl get pods -n monitor NAME READY STATUS RESTARTS AGE alertmanager-prometheus-operator-alertmanager-0 2/2 Running 0 13d prometheus-operator-grafana-749b598b6c-t4r48 2/2 Running 0 13d prometheus-operator-kube-state-metrics-d7b8b7666-zfqg5 1/1 Running 0 13d prometheus-operator-operator-667dd7cbb7-hjbl6 1/1 Running 0 13d prometheus-operator-prometheus-node-exporter-mgsqb 1/1 Running 0 13d prometheus-prometheus-operator-prometheus-0 3/3 Running 1 13d ``` To run the dashboard, enter the following command and go to http://localhost:9000 kubectl port-forward -n monitor prometheus-prometheus-operator-prometheus-0 9090 To see the visual representation at each level, we use Grafana. It provides some great visual insights regarding the usage, health and other metrics. We can also add more custom metrics. We will get real-time analysis of the data. kubectl port-forward $(kubectl get pods --selector=app=grafana -n monitor --output=jsonpath="{.items..metadata.name}") -n monitor 3000 Go to http://localhost:3000 and enter ‘admin’ as username and ‘prom-operator’ as password. These are the available options: We can configure alerts in many ways. We can access the dashboard to configure the AlertManager by going to http://localhost:9093 after executing this command: kubectl port-forward -n monitor alertmanager-prometheus-operator-alertmanager-0 9093 you can remove prometheus using helm ls --all helm ls --all prometheus-operator helm del --purge prometheus-operator kubectl delete crd prometheusrules.monitoring.coreos.com kubectl delete crd servicemonitors.monitoring.coreos.com kubectl delete crd alertmanagers.monitoring.coreos.com kubectl delete crd prometheuses.monitoring.coreos.com kubectl delete crd alertmanagers.monitoring.coreos.com kubectl delete crd podmonitors.monitoring.coreos.com
Pre:
kubeedge deployment
Next:
istio deployment
0
likes
259
Weibo
Wechat
Tencent Weibo
QQ Zone
RenRen
Submit
Sign in
to leave a comment.
No Leanote account?
Sign up now.
0
comments
More...
Table of content


No Leanote account? Sign up now.